Boston Matrix
A tool that helps businesses analyse their portfolio of products or services, in order to decide what to invest, continue or discontinue.
The Boston Matrix (often called the BCG or Growth/ Share matrix) was created by the Boston Consulting Group (BCG).
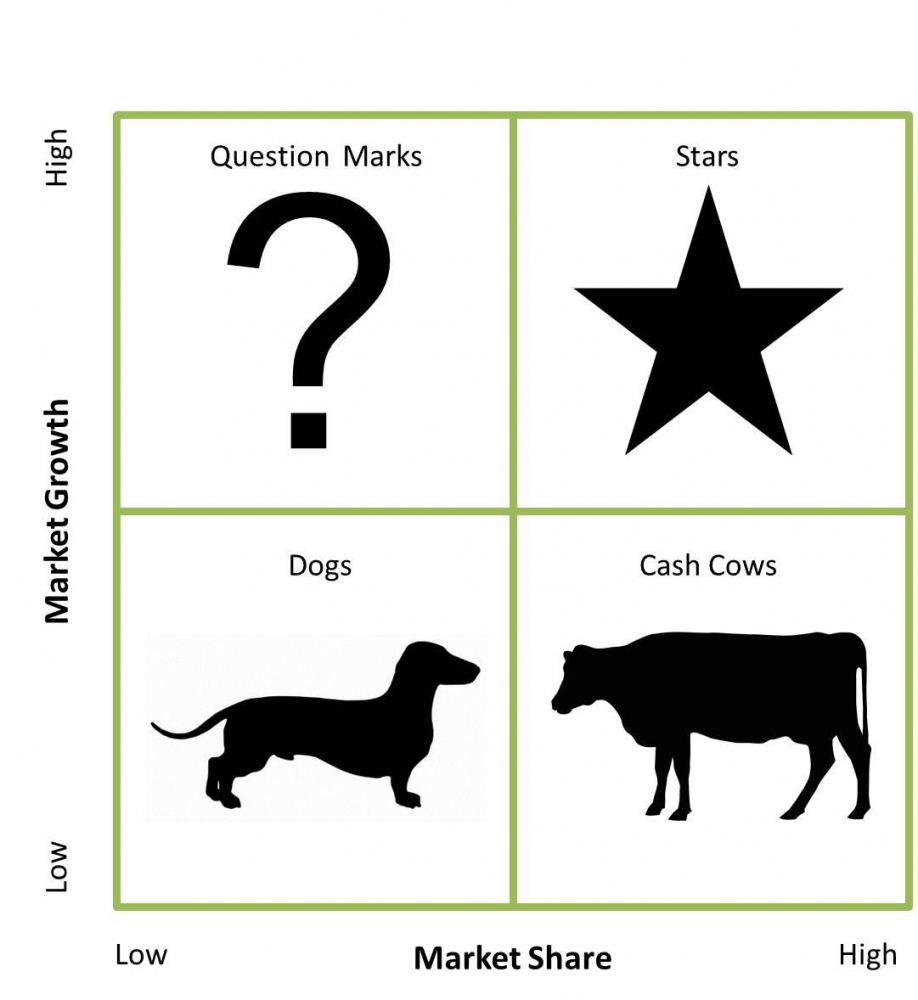
Start by placing your products on a 2 axis grid, based on the levels of relative market share (percentage of the market that your business controls) and the market growth (the increase in size of its consumer group).
By doing so, you are able to group your products into four categories:
1- Stars (high market share and high market growth)
- Leaders in their market and will likely need heavy investment to sustain it's market share.
2- Cash Cows (high market share and low market growth)
- Successful products in a mature market and are continued to generate strong cash flow, often to invest in the Star products.
3- Question Marks (low market share and high market growth)
- Potentially successful products which might need high investment to grow the market share.
4- Dogs (low market share and low market growth)
- Products that may generate enough profit to break even, but often not be worth investing in, due to having little market share in an unattractive market.
Why use the Boston Matrix?
The matrix provides a snapshot of where the portfolio of products sit in a current situation and can be a useful decision tool to allocate resources.